In the Bay Area, cycling is extremely popular and many of its cities rank among the most bicycle-friendly in the country.
However, not all roads are safe for cyclists and not all drivers operate their vehicles in a way that keeps cyclists safe. This is true across the country and in bicycle-friendly places like Marin County. The unfortunate reality is that cyclists are hit by motor vehicles every day in the United States.
Where, then, are Marin County Cyclists struck by vehicles most often?
We worked with Data visualization agency 1Point21 Interactive to find out.
Over a ten-year period from 2011- 2020 (the latest full year of data), there were 1,410 motor vehicle crashes involving at least one cyclist in Marin County. These crashes left nine cyclists dead and 1,415 injured, 230 of whom suffered serious injuries.
In terms of jurisdiction, bicycle collisions occur most often in unincorporated areas (507 crashes), followed by San Rafael (323), Novato (125), Sausalito (122), Larkspur (86), San Anselmo (82), Fairfax (46), and Mill Valley (43).
Interactive Map – Marin Bike Crashes
This map is interactive and shows the 25 most dangerous areas for cyclists in the county. Hover over each point for more information about the location and use the mouse wheel or touch gestures to zoom in and out. Circle size is determined by each location’s crash index score. If viewing on a mobile device, rotate screen for best viewing experience.
It is important to note that the point location is the closest cross street. In some cases, crashes may have occurred as many as several hundred feet from the intersection. As a result, cyclists should exercise caution when both approaching and exiting the intersections shown on the map.
While crashes are much less likely to occur within an intersection, we wanted to know what areas cyclists were at higher risk of a crash. To achieve this, we grouped collisions by their closest cross streets to tabulate the highest crash areas, then applied a weighted scoring method to account for the severity of the injuries.
In doing so, we noticed that a number of collisions occur on and around the Golden Gate bridge. In fact, over this time period, there were 43 bicycle collisions either on or nearby the bridge. Additionally, three of the 10 most dangerous areas for cyclists are directly related to cycling paths from the Golden Gate Bridge to Sausalito.
We found this to be so interesting, we went back and collected data from the other side of the bridge, in San Francisco, and performed an analysis solely on those crashes. Click here to view all crashes on the Golden Gate Bridge.
However, outside of that specific area, below are the ten most dangerous in Marin County.
Data Table: The Most Dangerous Road Crossings for Cyclists
| Rank | Crossing | Closest Town | Crashes | Injuries | Severe | Crash Index |
|---|---|---|---|---|---|---|
| 1 | Alexander Ave & Bunker Rd | Sausalito | 25 | 26 | 8 | 118 |
| 2 | Alexander Ave & East Rd | Sausalito | 19 | 19 | 4 | 84 |
| 3 | Pan Toll Rd & Panoramic Highway | Stinson Beach | 14 | 14 | 7 | 67 |
| 4 | Lucas Valley Rd & Nicasio Valley Rd | Nicasio | 12 | 14 | 2 | 57 |
| 5 | Baywood Canyon Rd & Sir Francis Drake Bl | Fairfax | 9 | 9 | 6 | 48 |
| 6 | Panoramic Highway & RT-1 | Stinson Beach | 10 | 10 | 4 | 44 |
| 7 | Bon Air Rd & Magnolia Ave | Larkspur | 10 | 10 | 1 | 40 |
| 8 | Alexander Ave & US-101 | Sausalito | 8 | 9 | 1 | 36 |
| 9 | 2nd St & Irwin St | San Rafael | 9 | 9 | 0 | 35 |
| 10 | Chapman Dr & Corte Madera Ave | Corte Madera | 5 | 6 | 4 | 31 |
| 11 | Bellam Bl & US-101 | San Rafael | 7 | 7 | 2 | 30 |
| 12 | Corte Madera Ave & Redwood Ave | Corte Madera | 7 | 8 | 1 | 30 |
| 13 | Bridgeway & Napa St | Sausalito | 8 | 8 | 1 | 30 |
| 14 | Bridgeway & Litho St | Sausalito | 8 | 8 | 0 | 28 |
| 15 | Lucas Valley Rd & Westgate Dr | Lucas Valley-Marinwood | 5 | 5 | 2 | 24 |
| 16 | Nicasio Valley Rd & Point Reyes Petaluma Rd | Nicasio | 5 | 5 | 2 | 24 |
| 17 | Bellam Bl & Belvedere St | San Rafael | 6 | 6 | 1 | 24 |
| 18 | Bridgeway & Caledonia St | Sausalito | 6 | 6 | 0 | 24 |
| T-19 | Andersen Dr & Bellam Bl | San Rafael | 6 | 6 | 1 | 23 |
| T-19 | Bridgeway & Princess St | Sausalito | 6 | 6 | 1 | 23 |
| 21 | Los Ranchitos Rd & North San Pedro Rd* | San Rafael | 4 | 3 | 0 | 22 |
| 22 | 4th St & Tamalpais Ave | San Rafael | 5 | 5 | 1 | 22 |
| 23 | Hicks Valley Road & Point Reyes Petaluma Rd | Petaluma | 1 | 4 | 4 | 21 |
| 24 | Bellam Bl & Lisbon St | San Rafael | 5 | 5 | 1 | 21 |
| 25 | East Blithedale Ave & Tower Dr | Alto Sutton Manor | 5 | 5 | 0 | 20 |
The Top Ten
#1. Alexander Avenue & Bunker Road
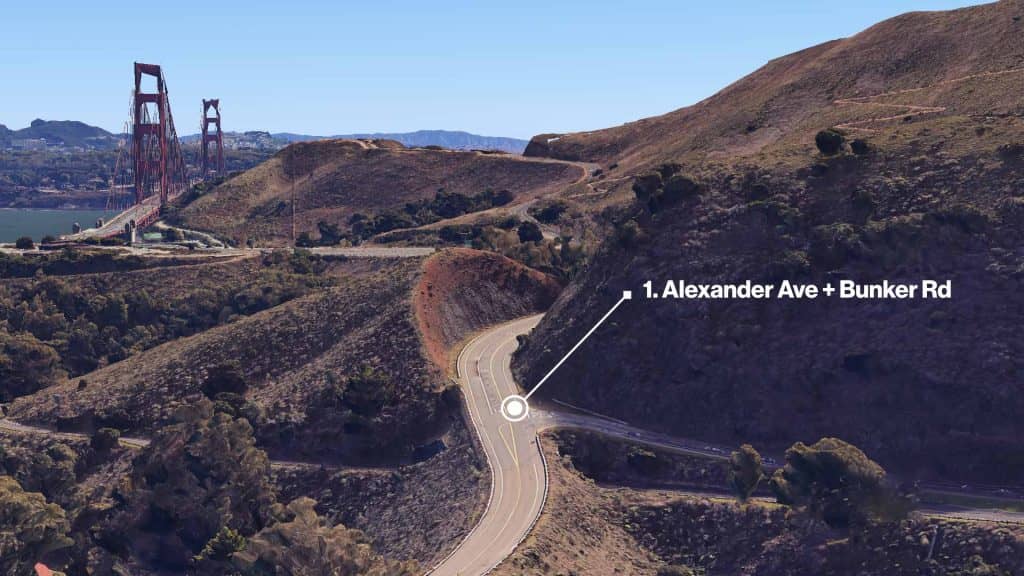
Bicycle Crashes: 25
Total Injuries: 26
Severe Injuries: 8
Crash Index Score: 118
This area of Alexander Avenue connects to the US-101 and the Golden Gate Bridge. There have been more bike crashes near this crossing than any other in Marin County. However, it’s not just the area near Bunker Road that is dangerous, it’s the whole corridor of Alexander Avenue from the 101 to Sausilito. In fact, number two on the list is less than a mile away.
#2. Alexander Avenue & East Road
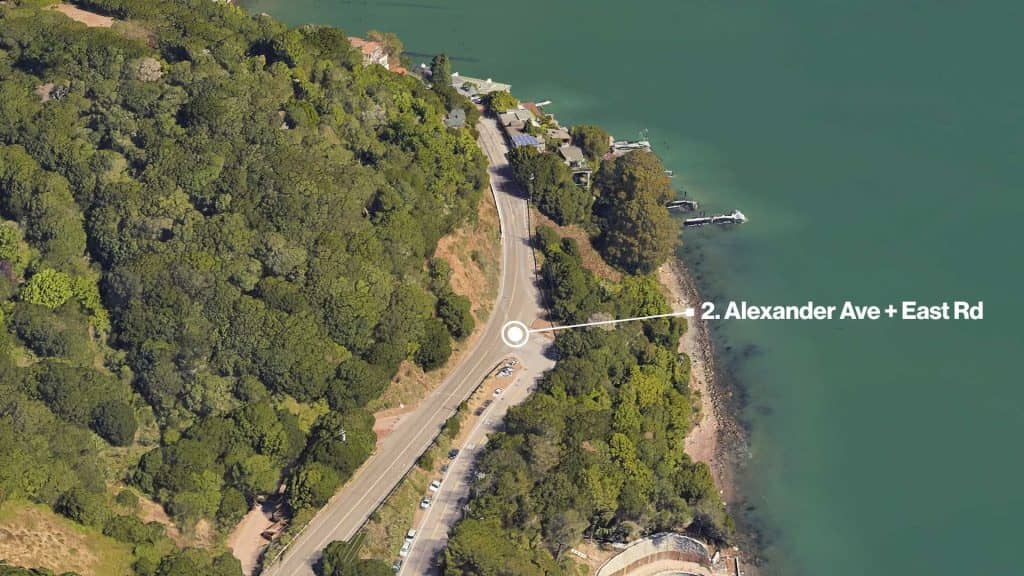
Bicycle Crashes: 19
Total Injuries: 19
Severe Injuries: 4
Crash Index Score: 84
Both areas encompass a very popular biking route from San Francisco to Sausilito. However, the road steeply descends and traffic moves at high speed and can stop suddenly and unexpectedly. Still, biking across the Golden Gate Bridge is a popular tourist activity, however, those who take this route should be very careful.
#3. Pantoll Road & Panoramic Highway
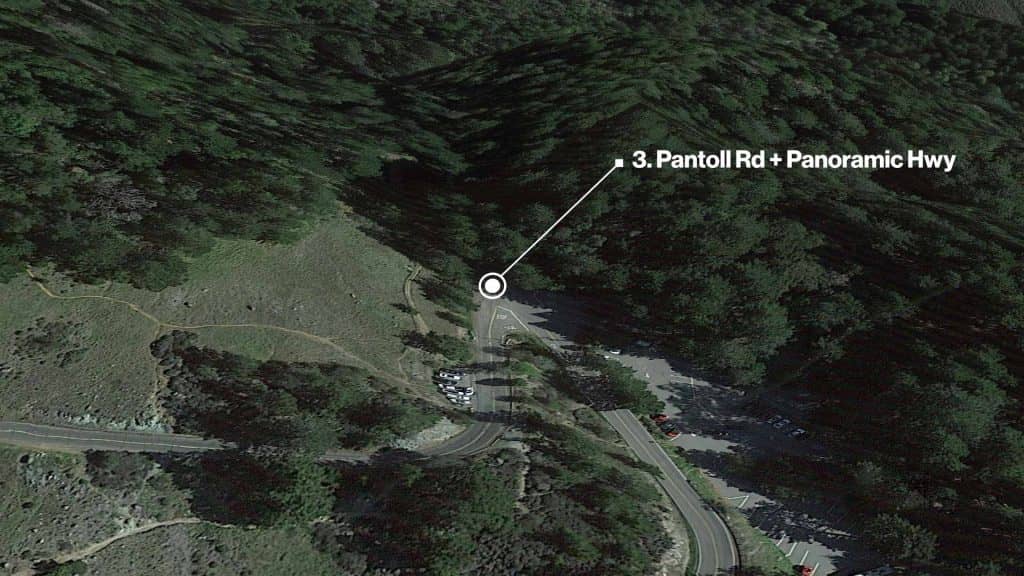
Bicycle Crashes: 14
Total Injuries: 14
Severe Injuries: 7
Crash Index Score: 67
This route covers a larger area of the Panoramic Highway and Pantoll Road that saw 14 bicycle crashes. Cyclists should be wary that there is no bicycle infrastructure on these roads and that they are full of sharp turns and blind corners.
#4. Lucas Valley Road & Nicasio Valley Road
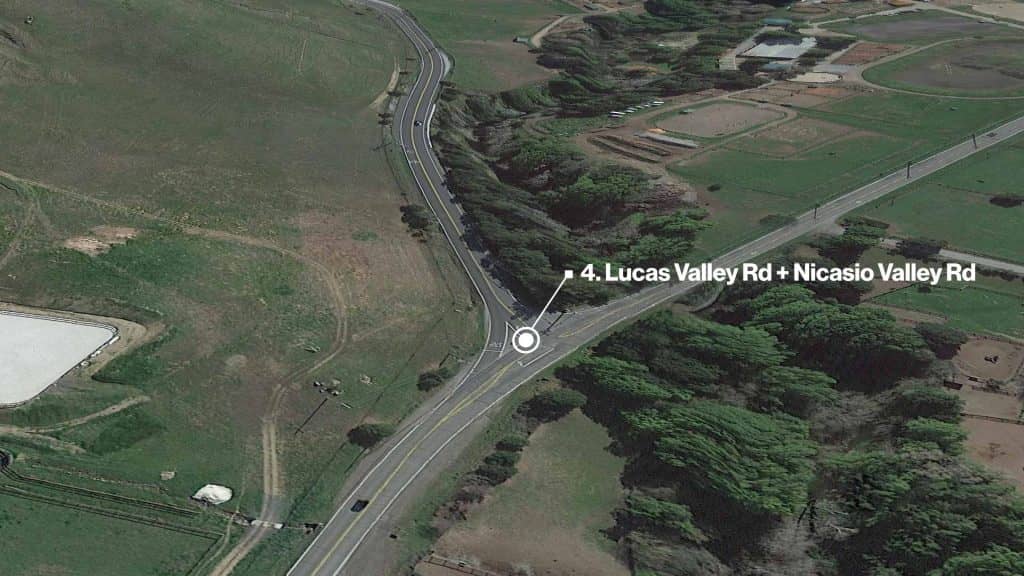
Bicycle Crashes: 12
Total Injuries: 14
Severe Injuries: 2
Crash Index Score: 57
Another rural area of road with no bicycle infrastructure, there have been 12 bicycle crashes near this crossing near Nicasio since 2010. The collisions here have occurred on both Lucas Valley Road and Nicasio Valley Road approaching and leaving this road crossing.
#5. Baywood Canyon Road & Sir Francis Drake Boulevard
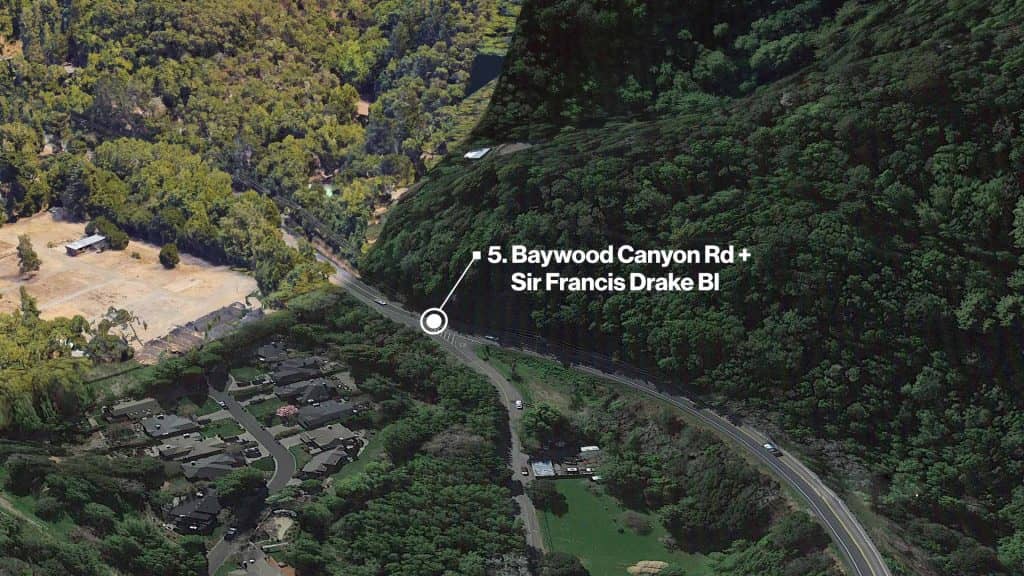
Bicycle Crashes: 9
Total Injuries: 9
Severe Injuries: 6
Crash Index Score: 48
This section of Sir Francis Drake Boulevard near Fairfax saw 9 crashes during the study period. Also found in a rural, incorporated area, this winding road has long stretches with no shoulder.
#6. Panoramic Highway & RT-1
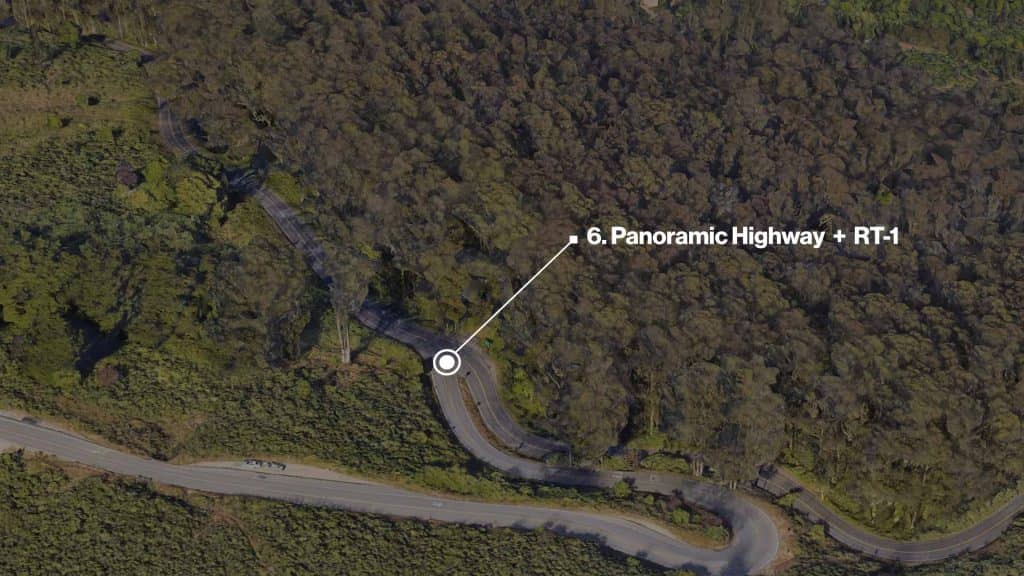
Bicycle Crashes: 10
Total Injuries: 10
Severe Injuries: 4
Crash Index Score: 44
Starting near Stinson beach and stretching up the Panoramic Highway towards Pantoll Road, this area was home to 10 crashes and 4 severe injuries. It is no surprise as the road is steep, winding and has no shoulder or bicycle infrastructure.
#7. Bon Air Road & Magnolia Avenue
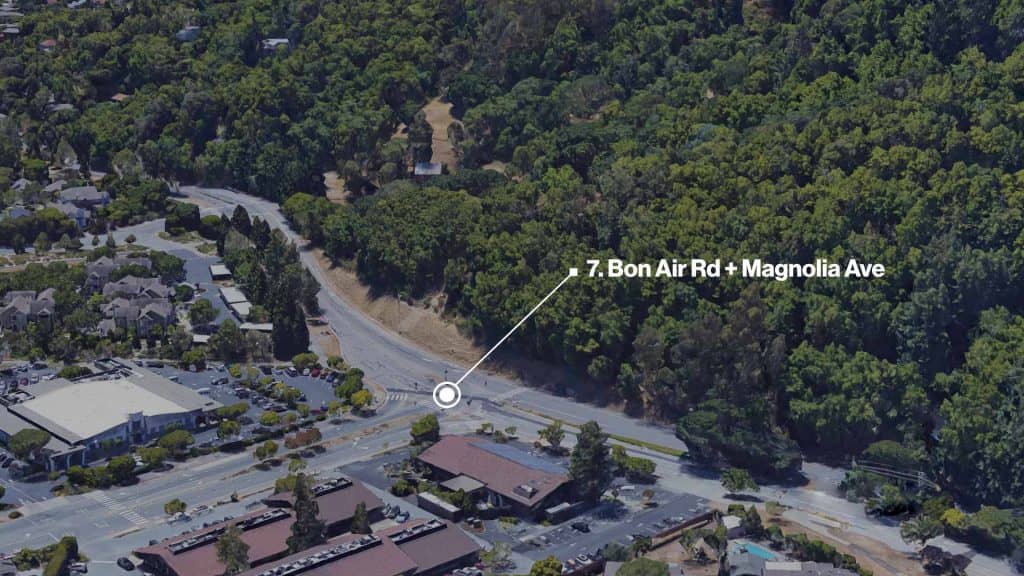
Bicycle Crashes: 10
Total Injuries: 10
Severe Injuries: 1
Crash Index Score: 40
This large t-intersection in Larkspur has seen 10 crashes since 2010. Recently, however, protected right-turn bike lanes were added to this crossing.
#8. Alexander Avenue & US-101
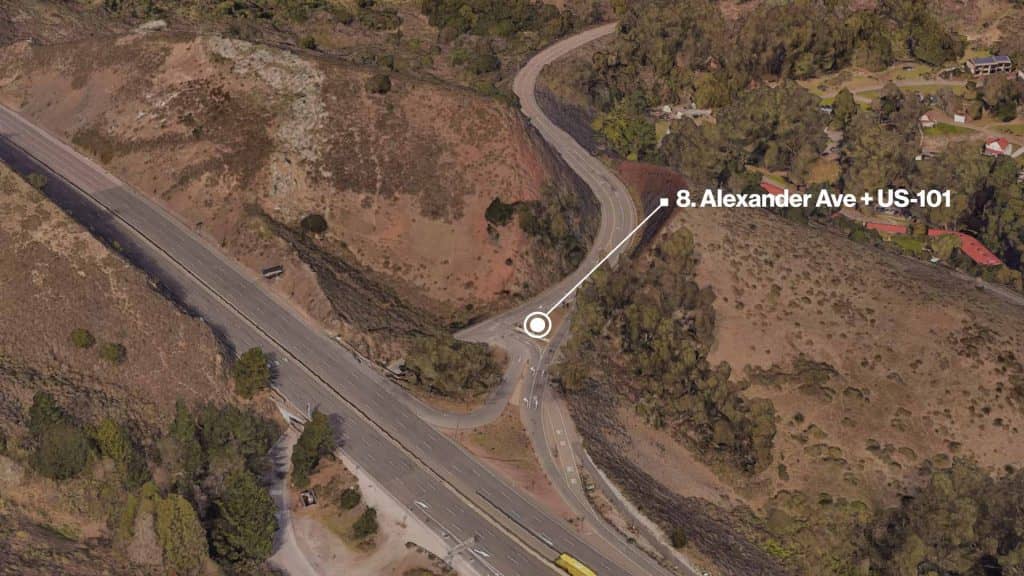
Bicycle Crashes: 8
Total Injuries: 9
Severe Injuries: 1
Crash Index Score: 36
Also related to the San Francisco to Sausalito bike route, crashes were dotted on bicycle paths, parking lots, and on and off ramps where Alexander Avenue meets the 101.
#9. Second Street & Irwin Street
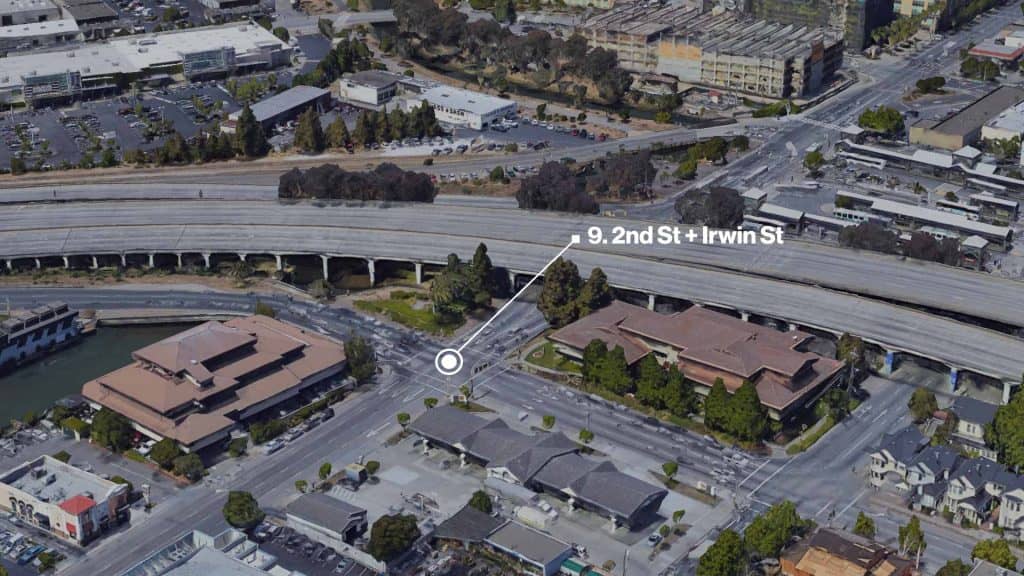
Bicycle Crashes: 9
Total Injuries: 9
Severe Injuries: 0
Crash Index Score: 35
Most of these crashes occurred on Second Street on either side of Irwin Street, but Second, Third and Fourth Street in San Rafael all had a high volume of collisions both near Irwin and out to Lincoln Avenue in one direction and Grand Avenue in the other.
#10. Chapman Drive & Corte Madera Avenue
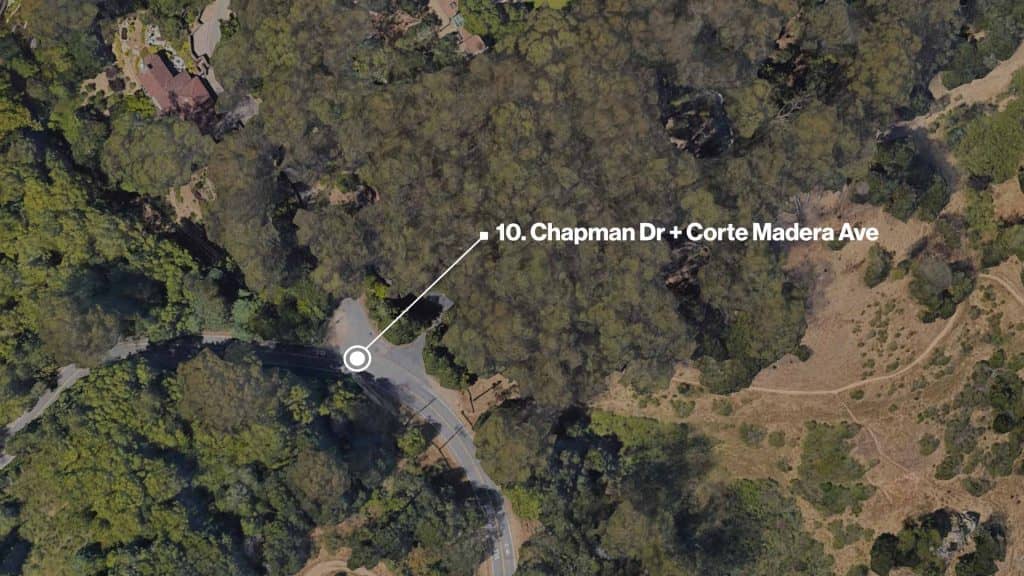
Bicycle Crashes: 5
Total Injuries: 6
Severe Injuries: 4
Crash Index Score: 31
This windy two-lane road is full of blind or sharp turns with no shoulder. Four of the five crashes here resulted in severe injuries. While the area near Chapman Drive ranked tenth, crashes were littered up and down Corte Madera Avenue and continue after it turns into Magnolia Avenue.
Data Sources and Fair Use
This study is based on 10 years of collision data (2011 through 2020) sourced from the CHP. Data for each crossing was calculated based on the cross streets indicated on each collision record. Rank was determined by our crash index metric, giving more weight to collisions that resulted in more serious injuries. If you would like to report on or republish the data, images, or maps included in this study, please link to this page for attribution.
