Over the last several years, Walkup, Melodia, Kelly & Schoenberger has explored traffic safety issues as part of our commitment to safety. Previously, we worked with 1Point21 Interactive to identify dangerous areas for pedestrians and bicyclists in San Francisco.
Today, we continue those efforts by examining bicycle-related motor vehicle crashes in San Mateo county. We analyzed five years of California crash data and isolated all collisions that occurred in San Mateo County in order to determine where the most dangerous areas for cyclists are.
[Interactive Map] Bicycle Collision Hot Spots in San Mateo County
The map below shows all bicycle-related collisions in San Mateo County. The size of the circle is determined by that location’s BCRI – Bicycle Collision Risk Index – which is a weighted score that accounts for both collision volume and severity of injuries. Additionally, we identified high-risk zones – larger areas where a higher volume of collisions occurred – which are highlighted in purple. This map is interactive, so users may zoom in to reveal more detail in a specific area and hover over each collision location for more information.
*If viewing on a mobile device, please rotate for the best user experience.
During our study period, there were 1,275 bicycle-related collisions in San Mateo County, resulting in 1,185 cyclist injuries and 9 cyclist fatalities.
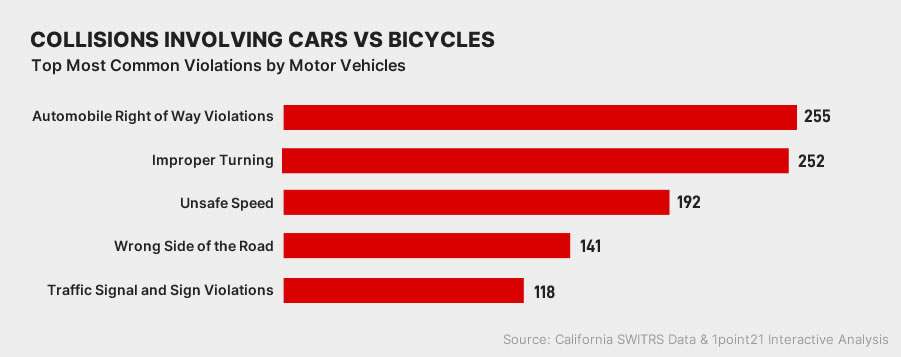
In these crashes, the most common vehicle violations included:

In San Mateo County, cyclists are – by far – more likely to be struck and injured during daylight hours with 82 percent of collisions and injuries occurring in those conditions.
High-Risk Collision Zones
As mentioned above, our analysis identified larger areas where cyclists may be at elevated risk of being struck by a motor vehicle. Our analysis utilized a 500-foot radius around each crash to find areas with high concentrations of bicycle-related collisions While these zones can stretch to cover large areas of a metro area, we believe that they are instructive to show where extremely high volumes of collisions occur. These zones can be a result of several factors, including high urban density, increased rates of bicycle commuting or inadequate Below are the five highest volume zones:
| Zone Name | Total Bicycle Crashes | Total Cyclist Injuries |
|---|---|---|
| Redwood City – El Camino Real | 226 | 197 |
| Menlo Park – El Camino Real | 86 | 76 |
| Burlingame – California Drive | 39 | 35 |
| Menlo Park – Willow Road | 35 | 31 |
| East Palo Alto – Bay Road | 33 | 31 |
Perhaps unsurprisingly, the two zones with the most crashes – by far- are centered along El Camino Real. The first, in Redwood City, had nearly three times as many bicycle-related crashes as any other zone with 226. While it’s true that this zone encompasses a much larger area, the simple fact is that an extremely high volume of collisions occurred within close proximity of one another. This area is a major focus of bicycle safety advocates and Redwood City is in the process of implementing significant changes to the area. It’s clear from the data that these improvements are needed.
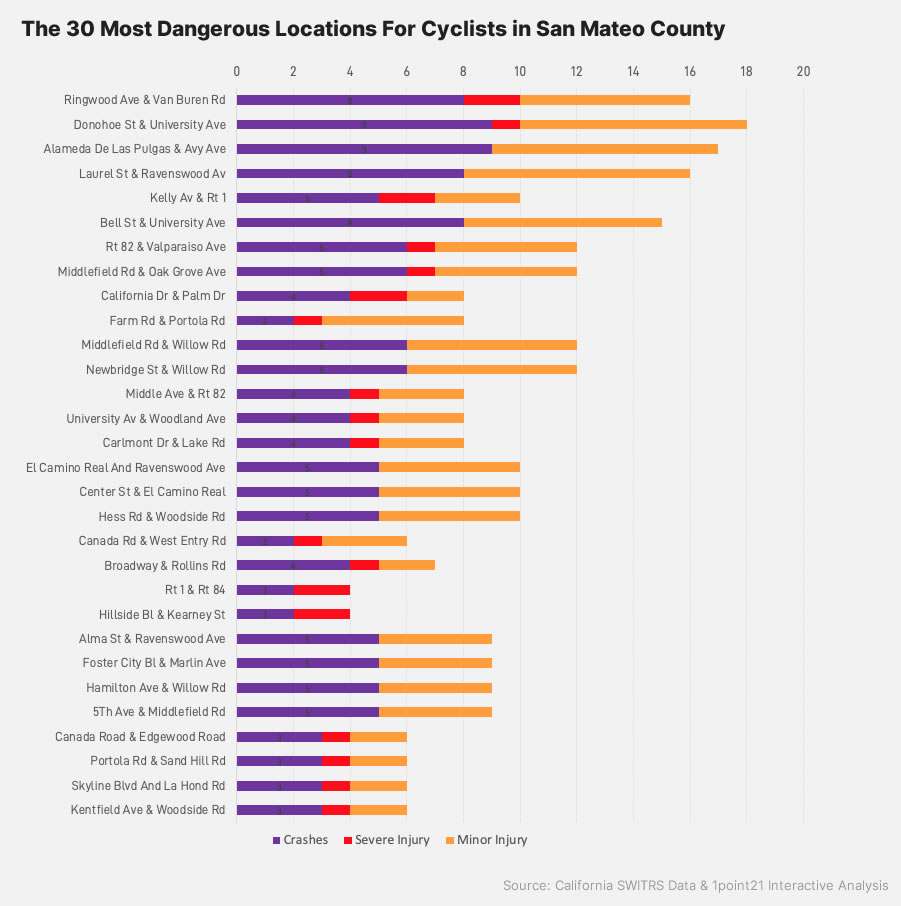
The 30 Most Dangerous Locations For Cyclists in San Mateo County

While bicycle-related collisions occur at a much lower rate than that of all motor vehicle crashes, they are much more likely to result in serious injury. Therefore, we found smaller areas where cyclists are at risk, typically the areas around specific intersections. We applied our Bicycle Collision Risk Index (BCRI) to these locations to find the 3o most dangerous areas in San Mateo.
| Location | City | Crashes | Severe Injury | Total Injury | BCRI |
|---|---|---|---|---|---|
| Ringwood Ave & Van Buren Rd | Menlo Park | 8 | 2 | 8 | 42 |
| Donohoe St & University Ave | East Palo Alto | 9 | 1 | 9 | 41 |
| Alameda De Las Pulgas & Avy Ave | Unincorporated | 9 | 0 | 8 | 33 |
| Laurel St & Ravenswood Av | Menlo Park | 8 | 0 | 8 | 32 |
| Kelly Av & Rt 1 | Half Moon Bay | 5 | 2 | 5 | 30 |
| Bell St & University Ave | East Palo Alto | 8 | 0 | 7 | 29 |
| Rt 82 & Valparaiso Ave | Atherton | 6 | 1 | 6 | 29 |
| Middlefield Rd & Oak Grove Ave | Atherton | 6 | 1 | 6 | 29 |
| California Dr & Palm Dr | Burlingame | 4 | 2 | 4 | 26 |
| Farm Rd & Portola Rd | Portola Valley | 2 | 1 | 6 | 25 |
| Middlefield Rd & Willow Rd | Menlo Park | 6 | 0 | 6 | 24 |
| Newbridge St & Willow Rd | East Palo Alto | 6 | 0 | 6 | 24 |
| Middle Ave & Rt 82 | Menlo Park | 4 | 1 | 4 | 21 |
| University Av & Woodland Ave | East Palo Alto | 4 | 1 | 4 | 21 |
| Carlmont Dr & Lake Rd | Belmont | 4 | 1 | 4 | 21 |
| El Camino Real And Ravenswood Ave | Menlo Park | 5 | 0 | 5 | 20 |
| Center St & El Camino Real | Redwood City | 5 | 0 | 5 | 20 |
| Hess Rd & Woodside Rd | Redwood City | 5 | 0 | 5 | 20 |
| Canada Rd & West Entry Rd | Woodside | 2 | 1 | 4 | 19 |
| Broadway & Rollins Rd | Burlingame | 4 | 1 | 3 | 18 |
| Rt 1 & Rt 84 | Unincorporated | 2 | 2 | 2 | 18 |
| Hillside Bl & Kearney St | South San Francisco | 2 | 2 | 2 | 18 |
| Alma St & Ravenswood Ave | Menlo Park | 5 | 0 | 4 | 17 |
| Foster City Bl & Marlin Ave | Foster City | 5 | 0 | 4 | 17 |
| Hamilton Ave & Willow Rd | Menlo Park | 5 | 0 | 4 | 17 |
| 5Th Ave & Middlefield Rd | Unincorporated | 5 | 0 | 4 | 17 |
| Canada Road & Edgewood Road | Unincorporated | 3 | 1 | 3 | 17 |
| Portola Rd & Sand Hill Rd | Woodside | 3 | 1 | 3 | 17 |
| Skyline Blvd And La Hond Rd | Woodside | 3 | 1 | 3 | 17 |
| Kentfield Ave & Woodside Rd | Redwood City | 3 | 1 | 3 | 17 |
How This Study Can Help
Cycling has steadily increased in popularity over the last decade and interest is currently surging in the midst of the pandemic. With the influx of cyclists on the roads, we believe that understanding the risks is more important than ever. It is true that many of the municipalities have implemented – or are in the midst of implementing – infrastructure changes to improve safety for bicyclists. Unfortunately, even with road improvements, cyclists will continue to be vulnerable to serious injury – especially when inattentive or distracted drivers are involved. Also, there is a very real stigma – and often outright hostility – towards road cyclists from drivers that elevate that risk. If both drivers and cyclists are aware of the full scope of the problem, it can go a long way towards making our roads safe for all users – motorists, cyclists and pedestrians alike.
In addition to taking note of the information in this study, there are steps that cyclists and motorists can take to improve safety:
Motorists
- Be aware of cyclists, especially when driving in any of the zones we identified in this study.
- Give cyclists plenty of space. Even when no dedicated lane is available, California law requires motorists to give cyclists three feet of space when overtaking them on the road.
- Don’t drive distracted. Cyclists can be difficult to see, an issue that is made much worse when your attention is not on the road and your surroundings.
- Double-check for cyclists when turning right. It is very common for motorists to turn right into cyclists, especially when turning right at a red light.
- Obey all traffic control devices and posted traffic signs. This can help keep both you and cyclists safe.
- Remember that cyclists are lawful road users, they have the same rights to the road that you do.
Cyclists
- Be visible, especially at night. Reflective clothing or parts on your bicycle can help.
- Don’t bike distracted. Just as with motorists, keeping your focus on your surroundings can help keep you safe.
- Obey all traffic laws. Bicycles are vehicles and are subject to many of the same laws. Make sure to obey traffic signals and signs.
- Be predictable. Ride in a straight line and avoid weaving in and out of cars.
- Watch out near parked cars. Cyclists are at significant risk in dooring accidents, which can knock them down or into oncoming traffic.
Sources and Fair Use
Our study analyzed traffic collision records from the California Highway Patrol, using GIS software. If you would like to report on our findings or republish any of the information, maps, or images, please provide attribution to Walkup, Melodia, Kelly & Schoenberger by linking to this study.


